Platform Guide
Actions
An action is a site-owner-defined task Teckel shows to agents visiting your website. Agents can present the action to a user and run it after collecting the required fields.
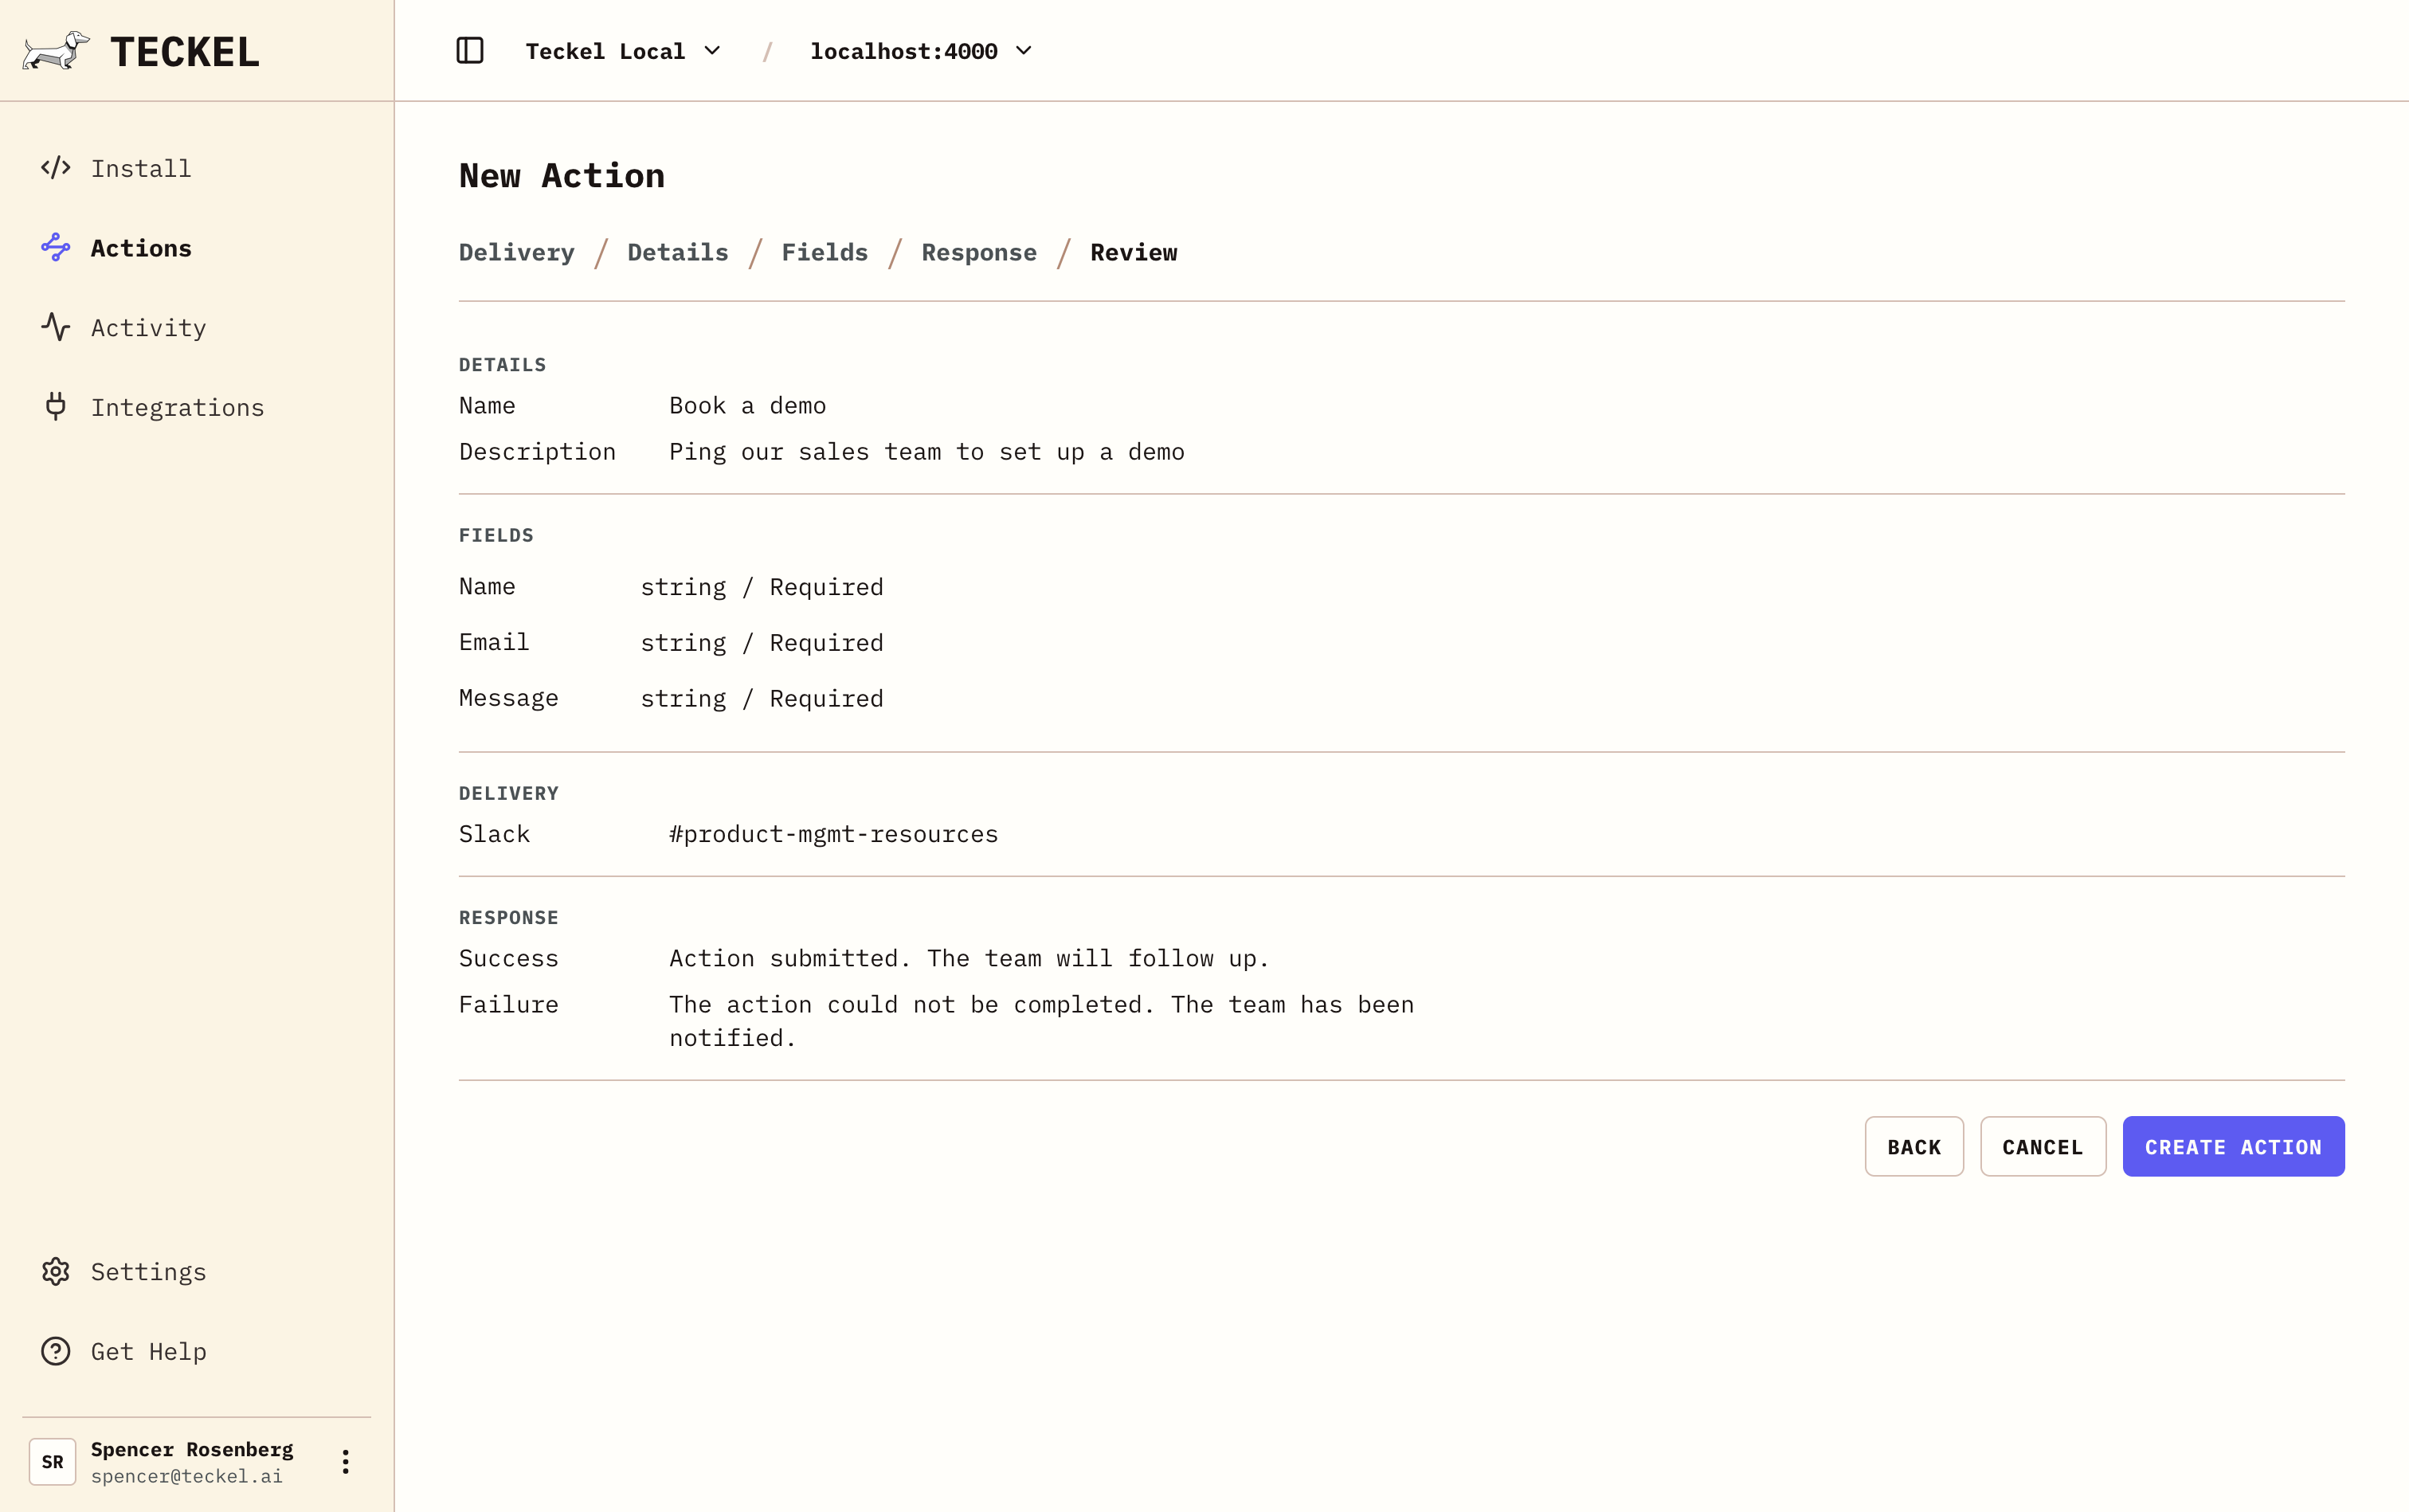
Each action has:
- A public name.
- A short description.
- Required and optional fields.
- A destination where Teckel sends completed requests.
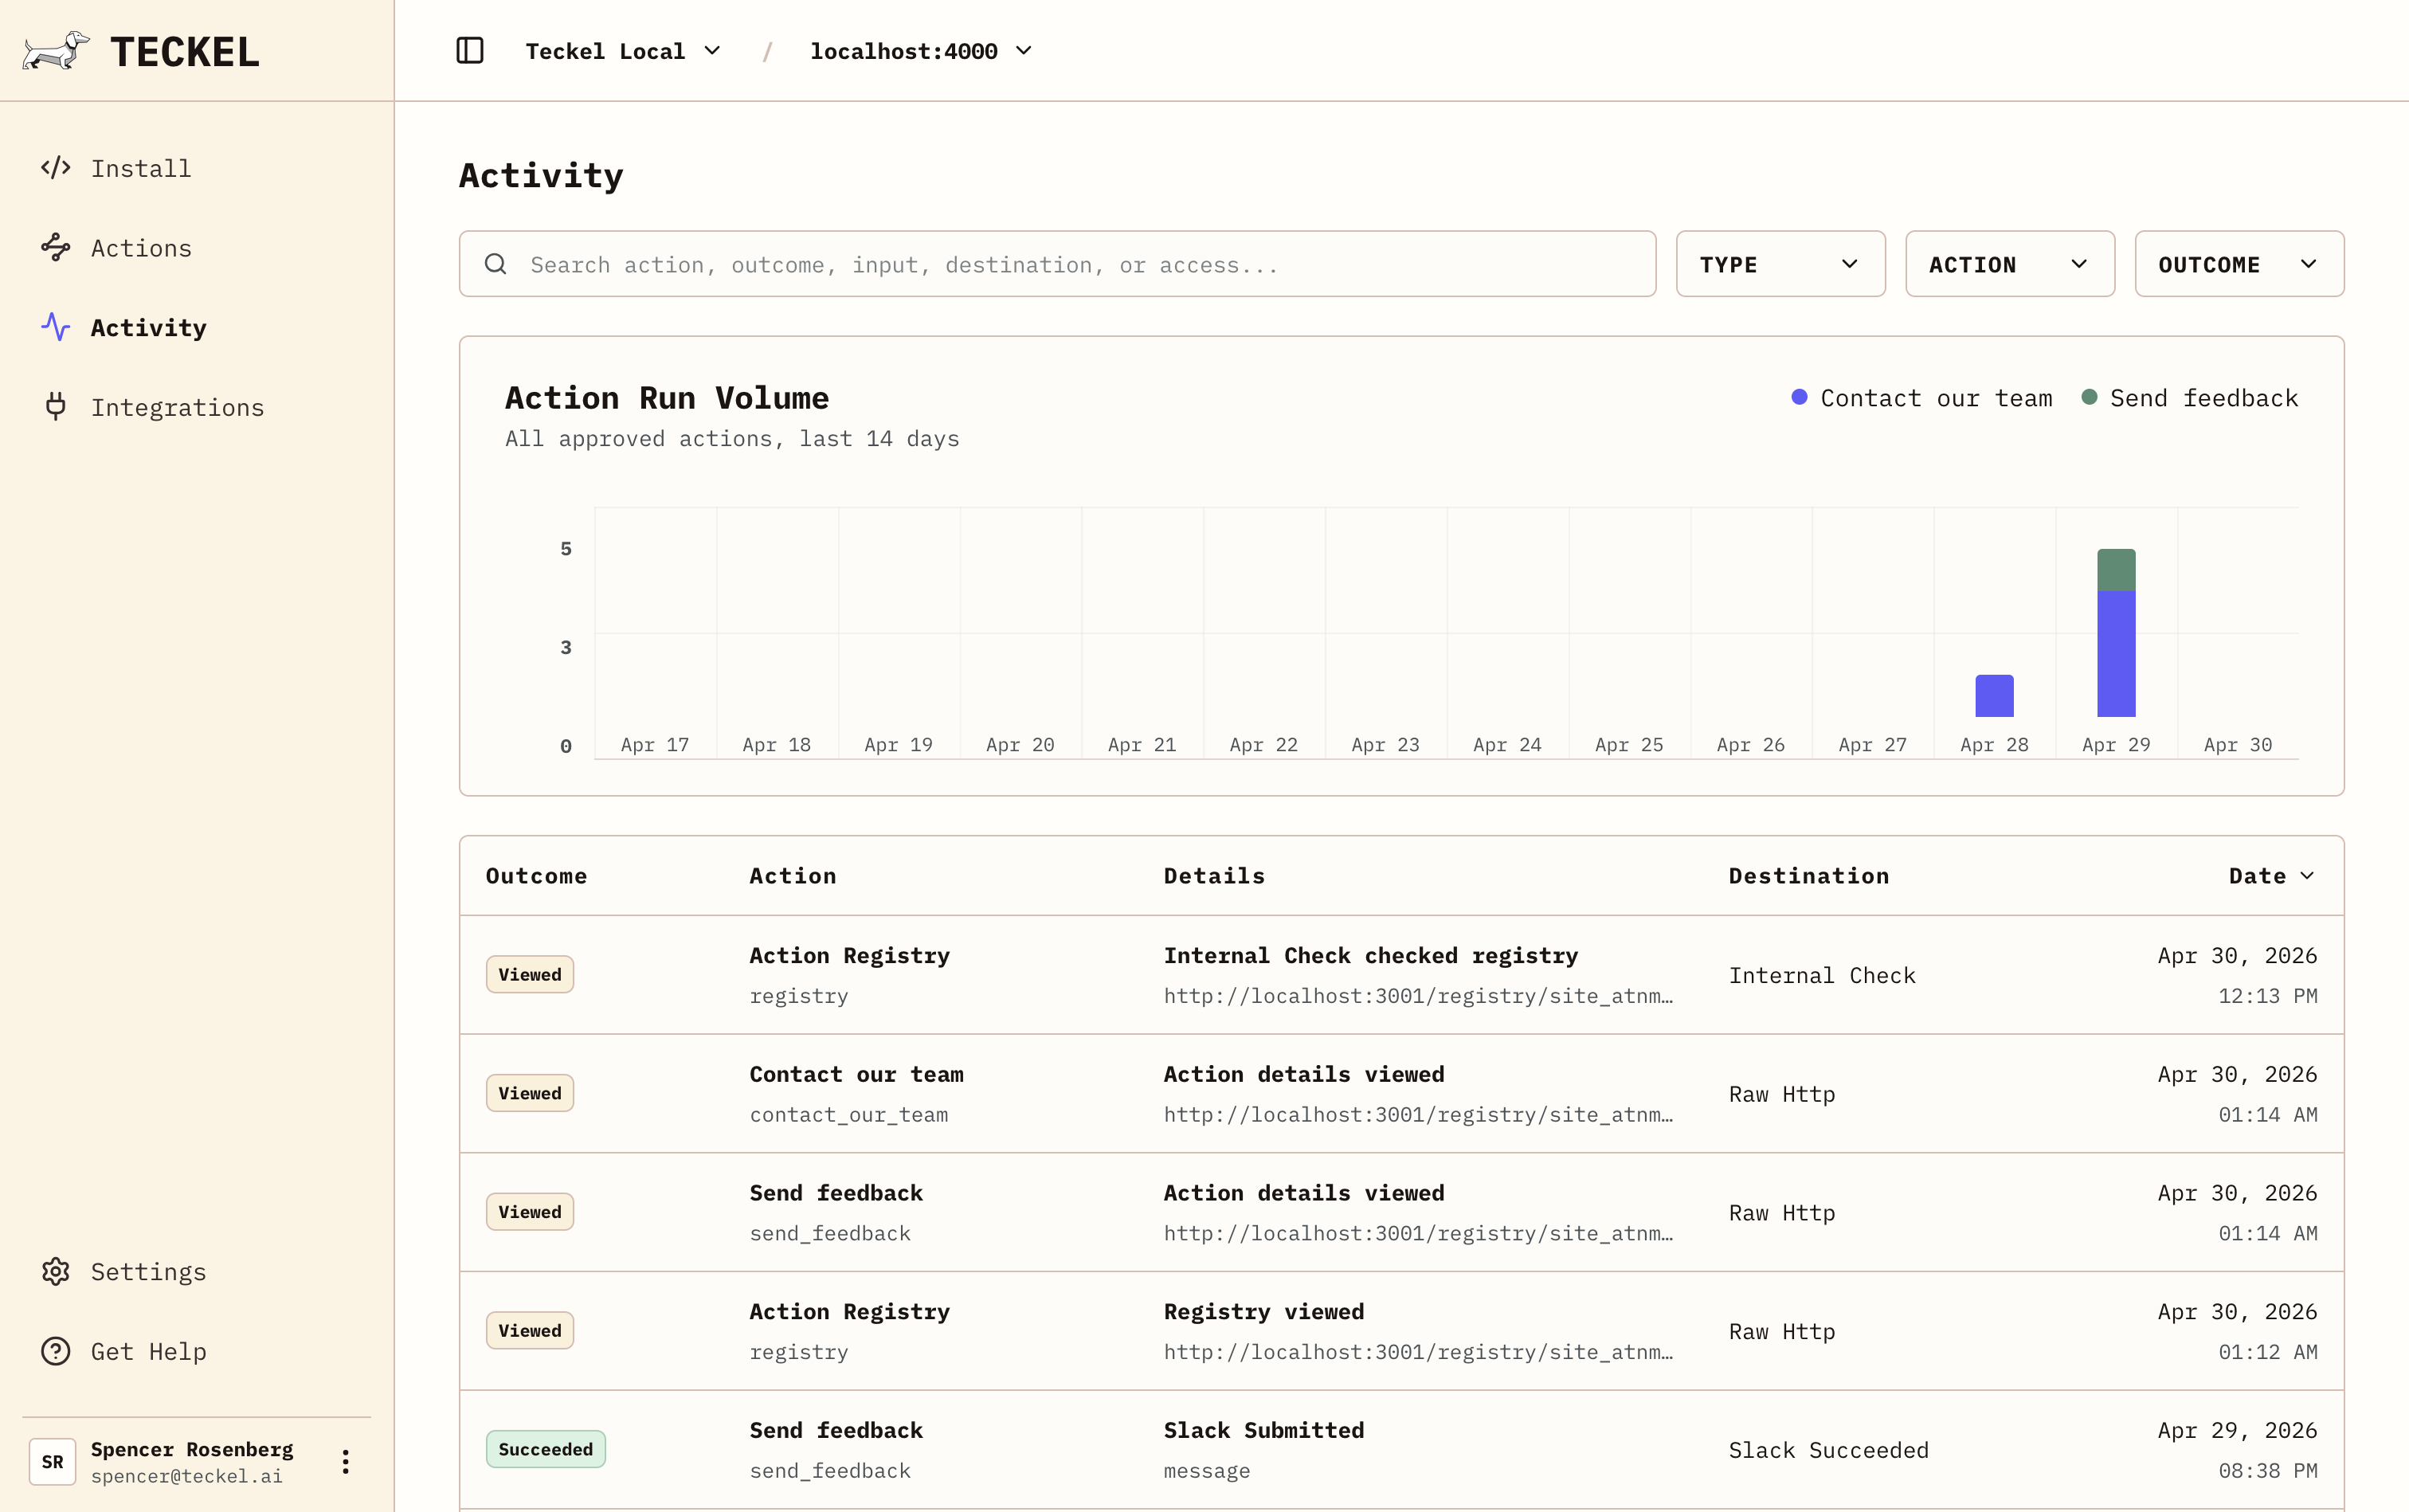
Activity
Activity shows how agents are finding and using the action registry. Every time an agent reads it or calls an action, Teckel logs the event for audit.
Integrations
Teckel supports many common third-party integrations such as CRMs, calendar management tools, and organization chat systems.
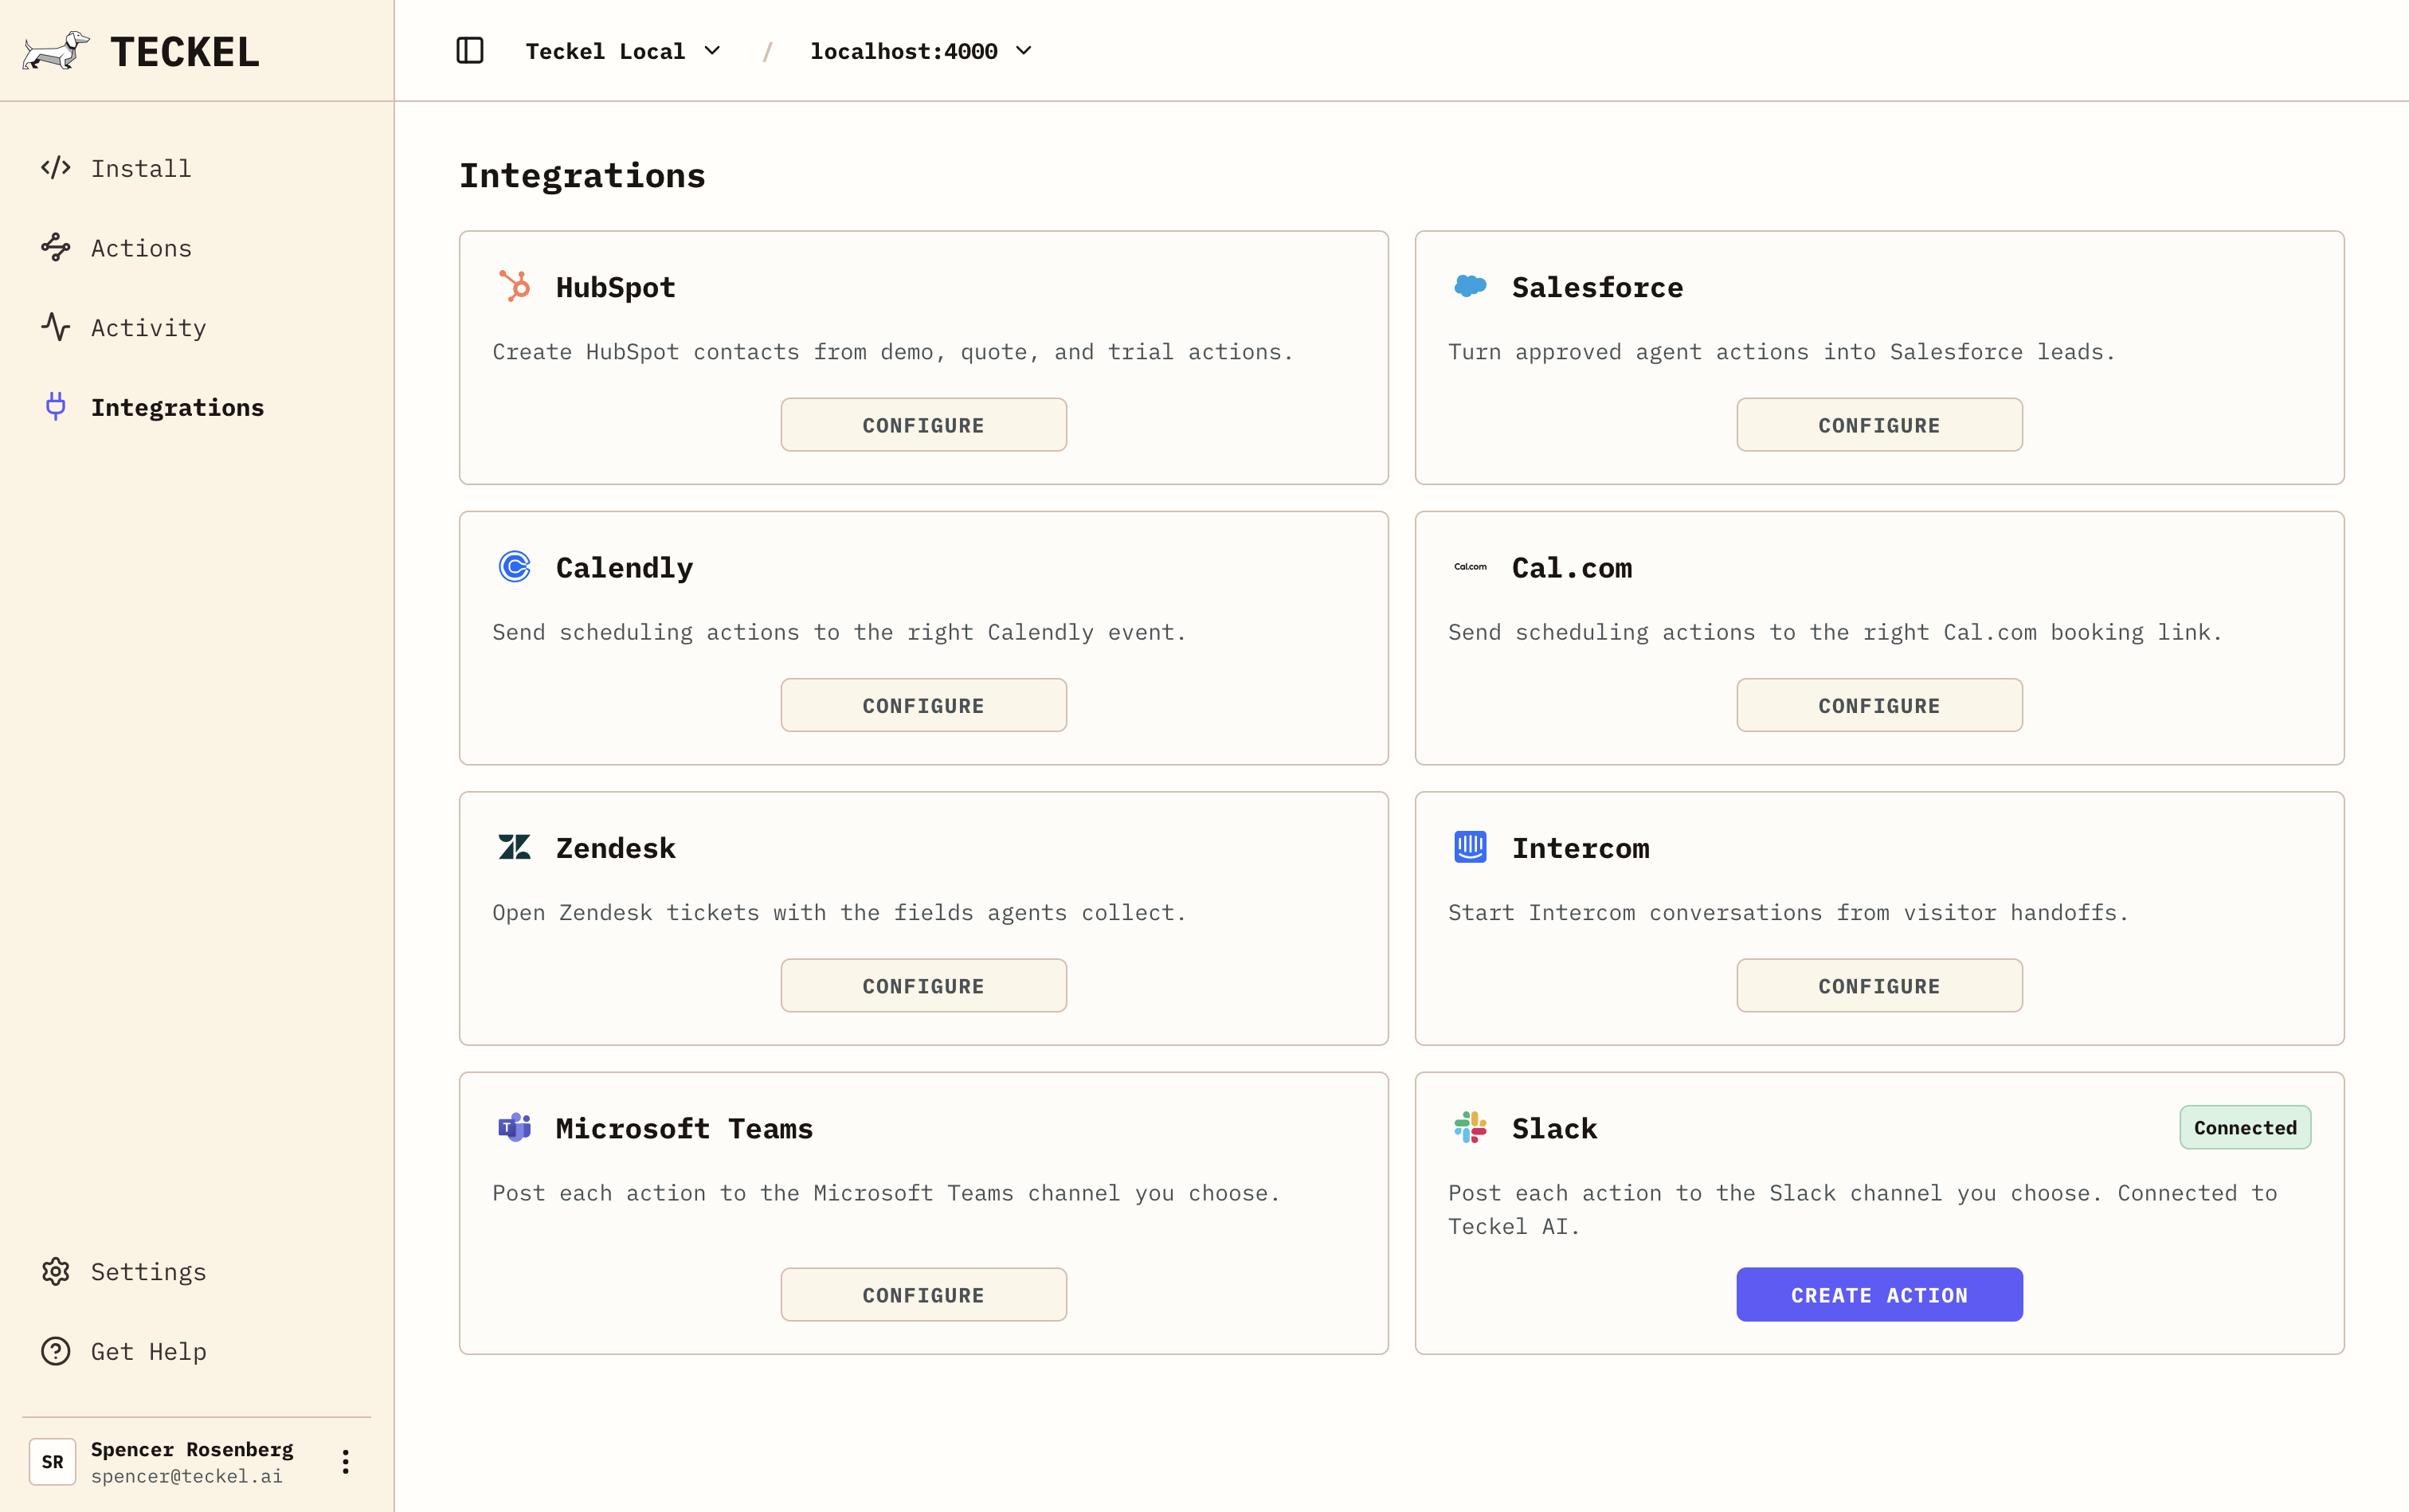
Slack and email work well for notifications like feedback for your team. Calendars can be used to book live demos. Configure agent requests to go directly to your CRM via integrations or webhooks for custom builds.
Install
Install Teckel in 5 minutes or less on your public website to point agents at your Action Registry.
We provide different types of AI agent visibility via:
- Your website script, so browser agents can read available actions on the page.
- Page metadata, so agents inspecting the HTML can find the Action Registry.
- llms.txt, so agents checking the site root get direct guidance.
- A well-known JSON file or response header, so crawlers and agent tools can discover the same actions outside the page body.
For example, Teckel's own site embeds metadata that points agents to this Action Registry:
GET https://app.teckel.ai/registry/site_leevwwtlarl0.json
Agents can fetch that registry to see the approved actions available on the site and the enabled ways to invoke them. The installed script and metadata all point to the same registry URL, so agents that inspect rendered pages, HTML metadata, llms.txt, well-known JSON, or response headers land on the same source of truth.
If a site owner disables HTTP Actions or MCP, Teckel removes that interface from the registry. If an agent tries a stale disabled endpoint, Teckel returns a structured message pointing back to the Action Registry and the currently enabled interfaces.
For the exact files, headers, and request flow, see System Architecture.